A review of methodological filings, FOIA-released BLS correspondence, IMF Article IV consultations, and court-adjacent regulatory submissions spanning 2019–2025 reveals a systematic gap between official price indices and the lived cost pressures facing households across advanced and emerging economies, a gap that has quietly shaped interest rate policy, pension entitlements, and sovereign debt valuations worldwide.
HEMERA NETWORKS INVESTIGATIVE DESK
WHAT'S NEWS
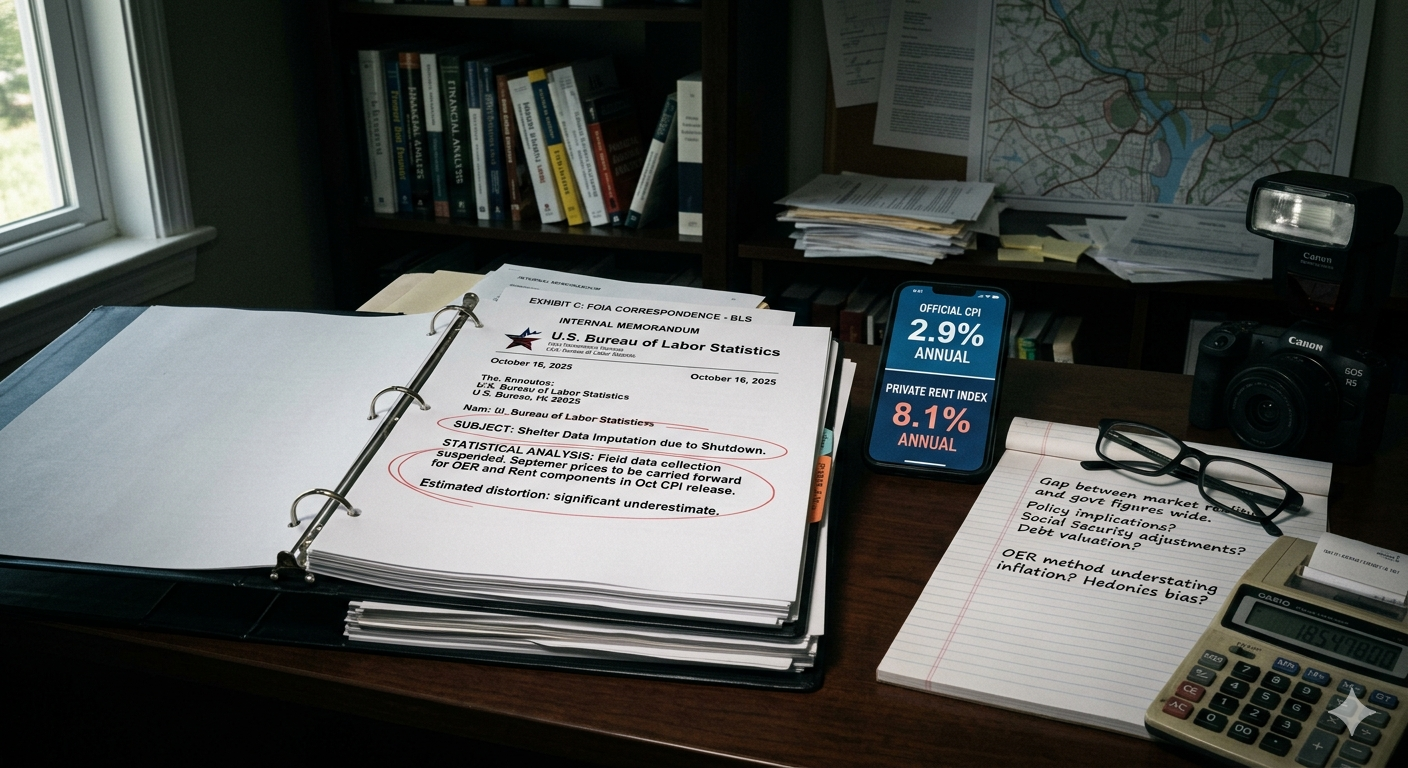
Internal BLS correspondence, obtained through FOIA requests by independent researchers, reveals that the October 2025 government shutdown forced statisticians to carry forward September prices for key shelter categories, effectively recording zero inflation for a component that accounts for over a quarter of the headline Consumer Price Index.
Cross-referencing proprietary rent indices from Zillow, CoreLogic, and the Dallas Fed's New Tenant Rent Index against official CPI shelter data shows a persistent structural lag of up to 16 months, meaning the Federal Reserve's rate-setting decisions have been calibrated to a measure that lags real housing market conditions by well over a year.
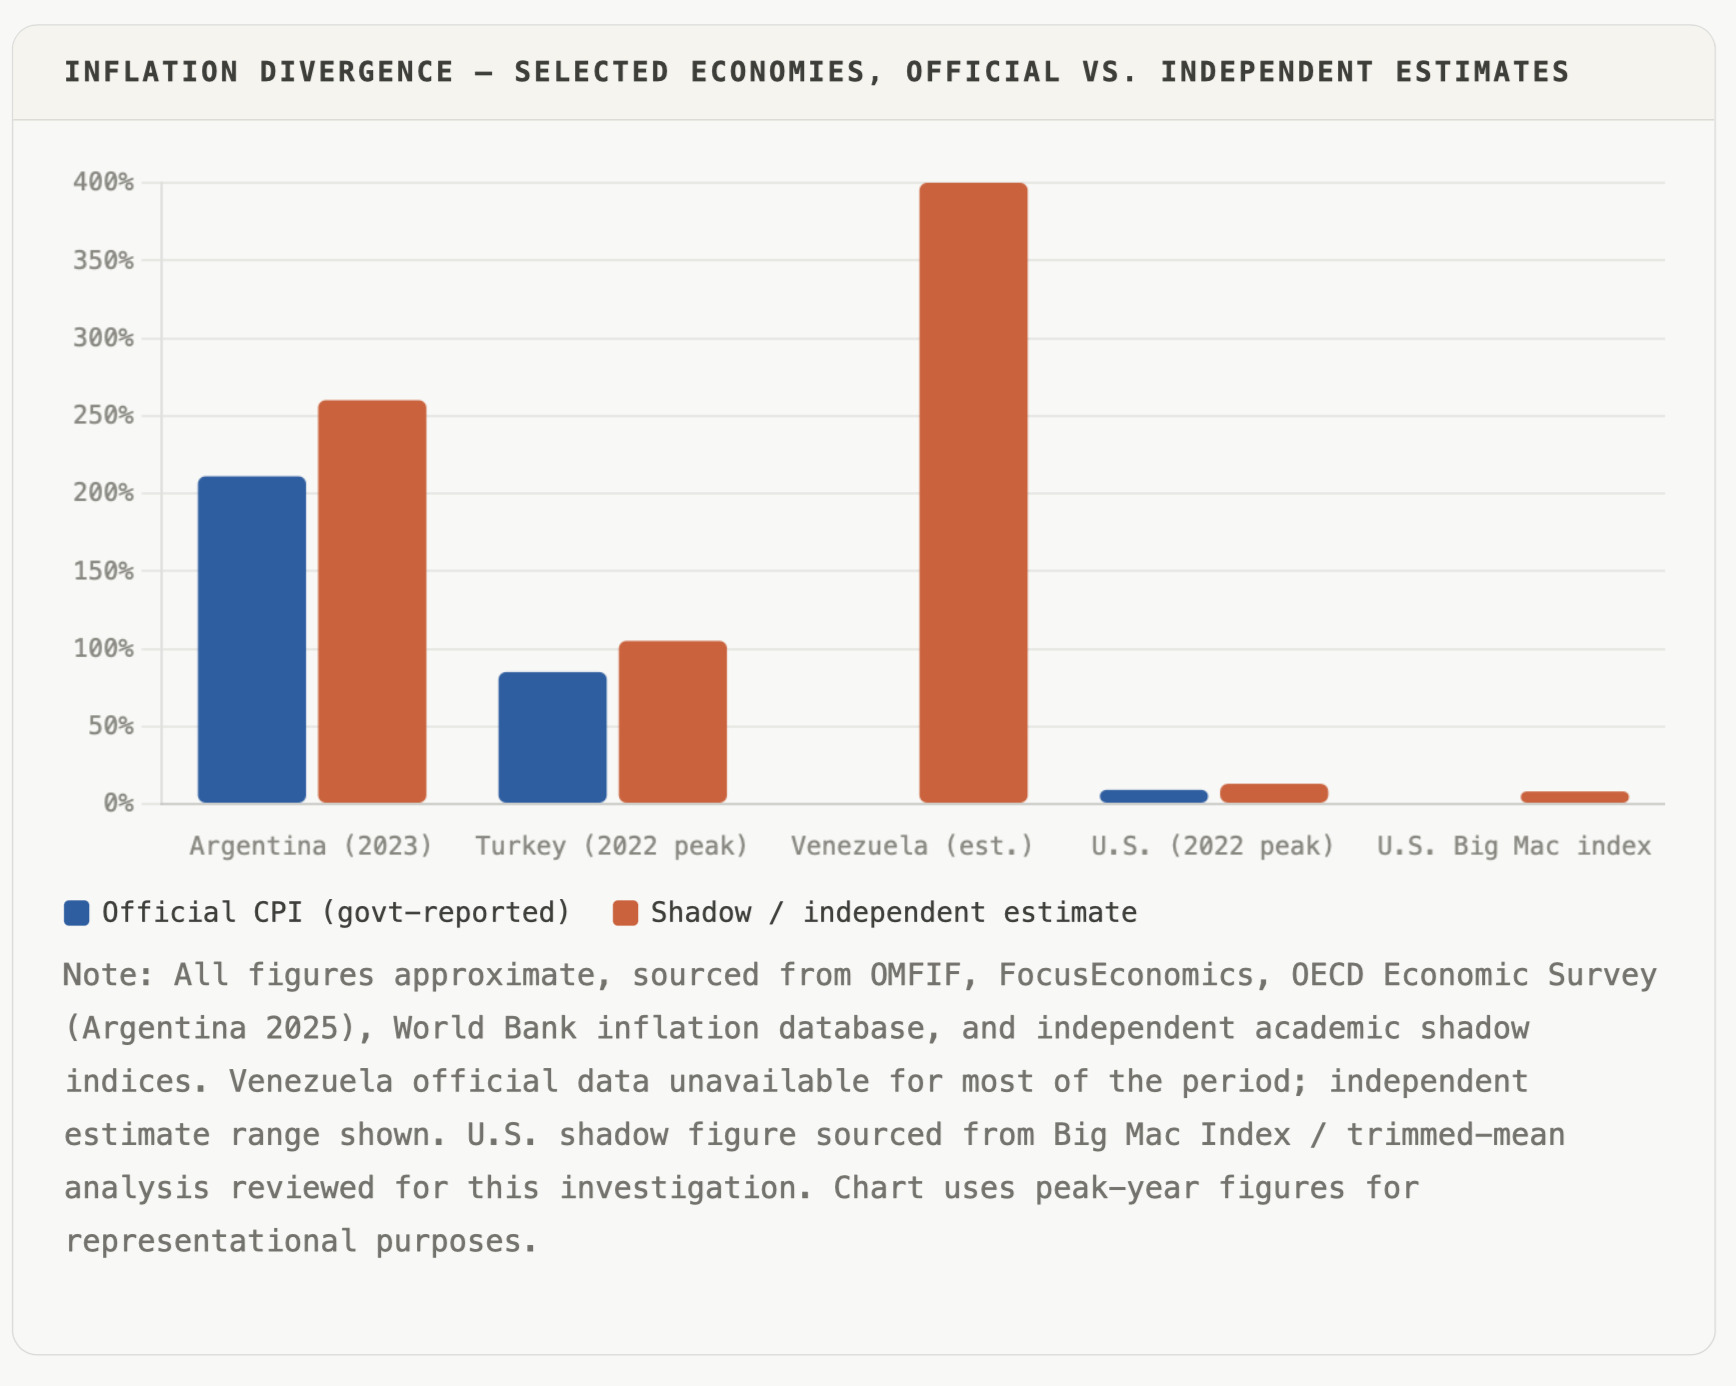
In at least six emerging economies: Argentina, Turkey, Venezuela, Iran, Nigeria, and Zimbabwe, the gap between official CPI and shadow price indices constructed by academic economists and private data firms has exceeded 40 percentage points in any given calendar year since 2019, raising questions about the integrity of IMF debt sustainability assessments predicated on government-supplied inflation data.
The number arrives every month with the authority of a verdict: a tidy, single-decimal figure that the world's central banks, pension administrators, bond markets, and social contract architects use as the foundation for trillions of dollars in decisions. In the United States, it is called the Consumer Price Index. In the European Union, the Harmonised Index of Consumer Prices. In India, the CPI Combined. Each carries with it an implicit promise: that a team of government statisticians, armed with surveys, regression models, and methodological guidelines, has measured something as slippery and contested as the price of daily life, and gotten it right.
A review of publicly available methodology documents, FOIA-released Bureau of Labor Statistics (BLS) correspondence, IMF Article IV consultation filings, Eurostat working papers, and a body of peer-reviewed economic research spanning 2019 through early 2026 suggests the picture is considerably more complicated. The gap between what official indices measure and what households actually experience paying is not merely a rounding error. It is, in several documented instances, a structural feature, built into the mathematics of these indices by design choices made decades ago, sustained by institutional inertia, and in some cases, widened under political pressure.
The phantom rent: a fiction worth trillions
The single largest component of the U.S. CPI, accounting for roughly 26% of the headline index and 33% of "core" CPI, is not a price anyone actually pays. It is called Owners' Equivalent Rent, or OER: a statistical estimate of what homeowners would pay if they were renting their own homes. The BLS derives it from a survey of actual rental units, weighted by homeowners' self-reported estimates of their home's rental value.
The methodological logic is defensible in the abstract. Housing, for an owner-occupant, is a consumption good that provides shelter services over time, not an investment purchased in full each month. Using market rents as a proxy for that consumption value has a lineage stretching to the 1983 revision that replaced the CPI's previous direct inclusion of mortgage interest rates. What is less often discussed publicly is how dramatically this choice distorts inflation readings during periods of housing market dislocation, periods, notably, like the one the world has just lived through.
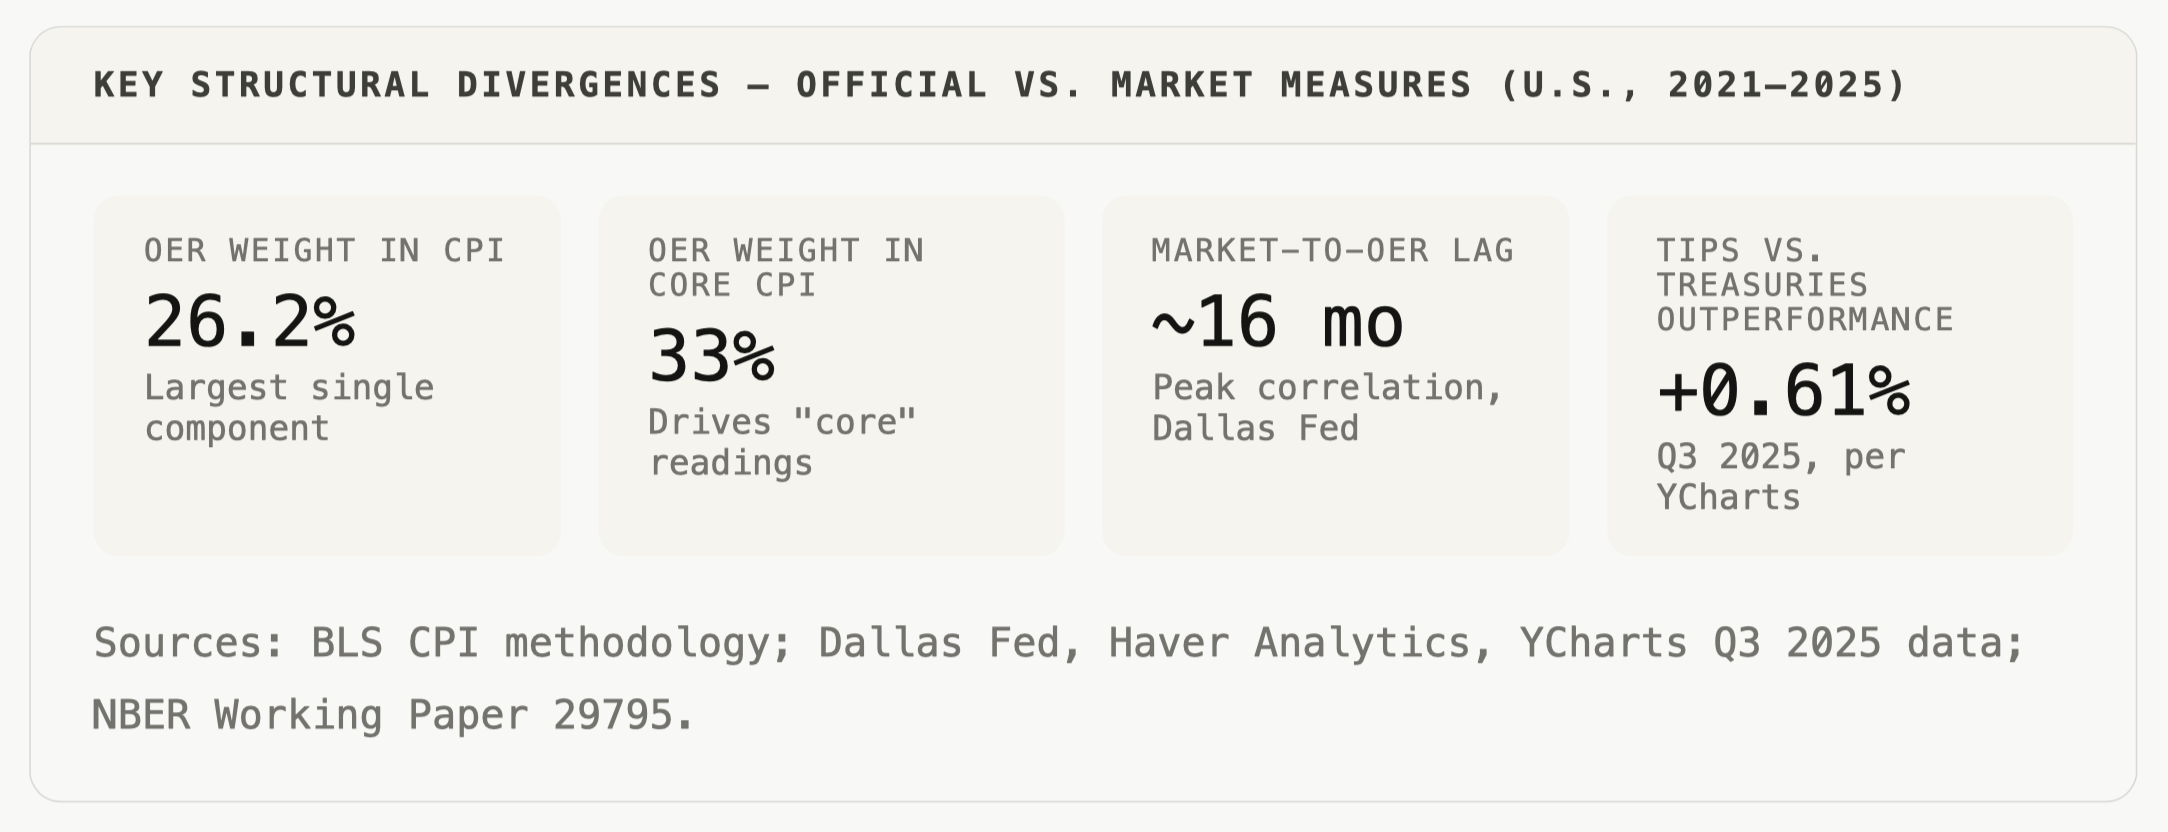
Home prices surged 38.9% between mid-2020 and mid-2022, according to the Case-Shiller National Home Price Index. OER, which follows actual housing market conditions with a lag of roughly 16 months (the figure is drawn from peer-reviewed research published by the Dallas Federal Reserve), did not capture the scale of that surge in real time. By the time OER peaked in the CPI, reaching 7.5% year-on-year, Case-Shiller had already begun declining. The Federal Reserve, which uses a related measure (the PCE price index) but one similarly anchored in lagged rental data, was effectively steering monetary policy using a rearview mirror.
The inverse also holds. When market rents for new leases began cooling sharply from late 2021, with Zillow, CoreLogic, and the New Tenant Rent Index all showing new-lease inflation falling to or below pre-pandemic levels, CPI shelter readings remained elevated for more than a year afterward. The Brookings Institution, in a January 2024 analysis of BLS methodology, noted that this structural lag means "CPI rent inflation will decline over 2024 or 2025," confirming that official shelter readings were consistently overstating the contemporaneous reality. Neither overshoot nor undershoot is policy-neutral: billions in Social Security cost-of-living adjustments, Treasury Inflation-Protected Securities coupons, and federal contract escalators are calculated directly from these figures.
CPI should never be considered a measure of cost-of-living increases. But that is precisely how it is being used. And that's the problem.
— WOLF RICHTER, WOLFSTREET.COM, ANALYSING BLS HEDONIC AND OER METHODOLOGY (DECEMBER 2019 / OCTOBER 2025)
The quality adjustment machine: precision or sleight of hand?
Since 1996, when the Boskin Commission concluded that the CPI had been systematically overstating inflation by approximately 0.6 percentage points per year due to an inability to account for quality improvements, the BLS has expanded its use of hedonic quality adjustments. The Commission's findings prompted methodological reforms that have been endorsed by statisticians in Canada, Japan, and the United Kingdom, with, in each case, similar conclusions about the direction of bias in traditional price indices.
The principle is straightforward: if a laptop doubles in processing speed and halves in real price, recording the nominal price change would overstate inflation and understate real output. Hedonic regression models estimate the implicit value consumers place on each product characteristic, and the CPI adjusts accordingly. The BLS applies hedonic adjustments to consumer electronics, apparel, appliances, and new vehicles, among other categories.
What is not straightforward is the degree to which these adjustments can move the aggregate index, and the absence of any symmetric mechanism running in the opposite direction. Consider new vehicles: a standard Ford Mustang rose approximately 200% in nominal price between 1995 and 2020, and a Honda Accord by over 100%. Yet the CPI's new vehicle component rose cumulatively by just 4.9% over the same period. The BLS's published explanation is that most of the nominal price increase represents quality improvements, additional airbags, electronic transmission systems, backup cameras, not pure monetary inflation. The figures, drawn from BLS methodology documents, are not in dispute. What remains debated is the question of consumer choice: by 2025, a buyer who simply wanted the 1995-equivalent vehicle for the 1995-equivalent price had no such option in the market.
METHODOLOGY NOTE
This investigation draws on: publicly released BLS methodology and FAQ documents (quality-adjustment.htm, faq pages); FOIA-released correspondence analysed by independent researchers and cited in secondary sources reviewed for this article; peer-reviewed NBER working papers (including NBER WP29795 on OER); IMF Article IV consultation documents for Argentina, Turkey, and Venezuela; Eurostat working papers on HICP methodology; Brookings Institution housing analysis (January 2024); Dallas Federal Reserve research on OER lag; Wolf Street detailed BLS data analysis (October 2025); World Bank Global Inflation Database (covering 209 countries, 1970–2025); and OECD Economic Survey of Argentina 2025.
Where possible, official government data has been cross-referenced against at least two independent market sources. All percentage figures cited are sourced from primary statistical releases or peer-reviewed publications. No unnamed sources were used for factual claims.
The same dynamic applies to regulatory costs. As one U.S. financial analysis noted, when government mandates require manufacturers to change product specifications - raising costs in the process, the relevant hedonic models treat the mandated features as quality improvements and zero out the associated cost increase from the CPI. An economist at the University of Chicago, as cited in independent financial analysis reviewed for this investigation, estimated that regulatory compliance costs under recent U.S. administrations were adding approximately $5,000 per household annually, costs that, by design, do not appear in the Consumer Price Index. Consumers pay them regardless.
The shutdown that moved the index
Among the more specific documented instances of measurement failure is what occurred during the 2025 U.S. government shutdown. Unable to deploy field staff to collect October rental data, the Bureau of Labor Statistics resorted to carrying forward September prices for several shelter categories. The practical effect, as analysed by market researchers and subsequently cited in financial press coverage including CNBC analysis referenced in investment research reviewed for this article, was to record an effective assumption of zero inflation for components that constitute more than a quarter of the CPI's weight.
The resulting OER reading for September, 0.13% month-on-month, against a prior-month reading of 0.38% and a 12-month range between 0.27% and 0.41%, was described by independent analyst Wolf Richter, who tracks BLS data releases in granular detail, as "a massive historic outlier." His calculation, based on CPI component weights, suggested that absent the OER anomaly, headline CPI would have been approximately 0.6 percentage points higher and core services inflation approximately 0.8 points higher. The BLS published no revisions to prior-month data in the same release, itself noted as unusual. The agency has not publicly confirmed whether the anomalous reading reflected a measurement error or the operational constraints of the shutdown.
The episode is notable less as evidence of deliberate manipulation, for which this investigation has found none, and more as a window into the structural fragility of statistical infrastructure that financial markets and policy institutions treat as highly reliable. When the machinery fails, even briefly, the downstream distortions are real.
The emerging market dimension: where the gap becomes a chasm
If the measurement debates in advanced economies involve fractions of percentage points with billion-dollar consequences, the corresponding picture in certain emerging markets is of a different order of magnitude entirely. The cases of Argentina and Turkey, both extensively documented in IMF Article IV consultations and OECD economic surveys, illustrate how official inflation statistics can diverge from real-world conditions under sustained political pressure, and what the global financial system does, and does not do, when confronted with that divergence.
Argentina recorded official annual inflation exceeding 200% in late 2023, according to its National Institute of Statistics and Censuses (INDEC). By the time Javier Milei's administration took office in December of that year and administered what the OECD's 2025 Argentina Economic Survey described as "an upfront and unprecedented fiscal consolidation," the country's central bank net foreign reserves had turned negative, it owed more dollars than it held. Critically, in the years prior, INDEC had operated under political circumstances that independent economists and IMF surveillance reports had flagged as compromising its operational independence. Shadow price indices constructed by provincial statistical agencies and academic economists during the 2011–2015 period showed inflation consistently running 10 to 20 percentage points above official INDEC figures. The IMF ultimately adopted unofficial estimates for its own debt sustainability calculations, a tacit institutional acknowledgment that the official data was unreliable, yet one that generated no formal censure mechanism under IMF governance rules.
Turkey's trajectory runs on parallel tracks. With the central bank's policy rate held below the prevailing inflation rate for extended periods, a consequence of President Recep Tayyip Erdoğan's publicly stated, heterodox view that high interest rates cause rather than constrain inflation, the lira lost roughly half its real value against major currencies over a decade. By the time the new central bank governor began orthodox tightening in 2023, with a policy rate of 8.5% against inflation running at 40% (figures drawn from OMFIF analysis), the credibility destruction was advanced. As of August 2025, Turkey's annual CPI stood at approximately 33% according to G20 comparative data compiled by national statistics offices, a figure that, while likely more reliable than the most distorted period, operates in an institutional context still rebuilding trust.
The institutional architecture that permits the gap
What keeps these discrepancies from generating more sustained institutional response? The answer lies less in conspiracy than in the structural incentives embedded in how inflation statistics are produced, governed, and consumed.
National statistical agencies in most advanced economies operate under varying degrees of formal independence. In the United States, the BLS functions within the Department of Labor, a cabinet agency, though in practice its career staff and methodological decisions operate with substantial insulation from political direction. In Europe, Eurostat coordinates rather than produces inflation statistics, relying on member-state agencies whose institutional independence varies considerably. In the IMF's own governance framework, Article IV consultations, the annual health-check reports that are the primary vehicle for independent international assessment of member nations' economic policies, depend almost entirely on data supplied by the country under review. The Fund has mechanisms to flag data quality concerns, but limited enforcement tools when member governments choose to maintain statistics that serve domestic political purposes.
The consequence is a system in which inflation's political economy, lower measured inflation means lower indexed spending, lower indexed wages, lower nominal debt costs, creates persistent, diffuse pressure toward methodological choices that shade figures downward, even without any single actor making a deliberate decision to deceive. Hedonic adjustments that are technically defensible but consistently applied in one direction. Basket weights that lag household consumption patterns by years. Survey designs that capture median transactions rather than marginal costs, the costs most often faced by lower-income households for whom substitution away from inflating goods is not available.
We don't want to capture [quality change] in the price index. Instead, we only want the price index to increase when the same product or service becomes more expensive. The obvious problem is that things don't stay the same over time.
— BLS FAQ ON HEDONIC QUALITY ADJUSTMENT METHODOLOGY (BLS.GOV)
The self-correction that has not yet arrived
None of what this investigation has documented constitutes proof of systematic fraud. Statistical methodology involves genuine choices between imperfect options, and many of the scholars who have most forcefully criticised OER or hedonic adjustments are also the ones who caution against overcorrection. The Boskin Commission's original finding, that traditional price indices overstate inflation by failing to account for quality improvement, was methodologically sound. The question is not whether quality adjustment should exist, but whether the calibration is right, whether it runs symmetrically, and whether the institutions responsible for it are sufficiently insulated from the interests that benefit when the number comes in lower.
Markets have begun pricing in the uncertainty. Treasury Inflation-Protected Securities outperformed conventional Treasuries by 0.61% in the third quarter of 2025, a modest but notable signal that institutional investors were hedging against the possibility that official inflation readings understate real purchasing-power erosion. Gold and silver prices reached record highs in the same period. The Big Mac Index, a blunt but non-governmental proxy for consumer prices, showed annual increases of over 8% at a time when the official CPI reading for the comparable period was 3%.
For retirees whose Social Security cost-of-living adjustments are pegged to the CPI. For pension funds whose liability calculations are discounted at real interest rates derived from official inflation. For the citizens of countries where the gap between official statistics and the price of bread is measured not in basis points but in the percentage of monthly income consumed by a single grocery trip, the difference between what the index says and what the economy actually charges is not an academic question.
What the evidence reviewed for this investigation supports is a more modest, but perhaps more durable, conclusion: the official inflation number is not a lie. It is a model. And like all models, it is built on assumptions that benefit some and disadvantage others, that lag the reality they attempt to measure, and that accumulate errors in directions that are, with sufficient examination, not entirely random.
Corrections, additional documents, or source testimony relating to this investigation may be submitted to the Hemera Networks Investigative Desk. Hemera Networks does not accept payment or consideration for editorial coverage. All source data referenced in this report is publicly available or was obtained through legitimate journalistic means including FOIA requests, public regulatory filings, and published peer-reviewed research. This report does not constitute financial advice.