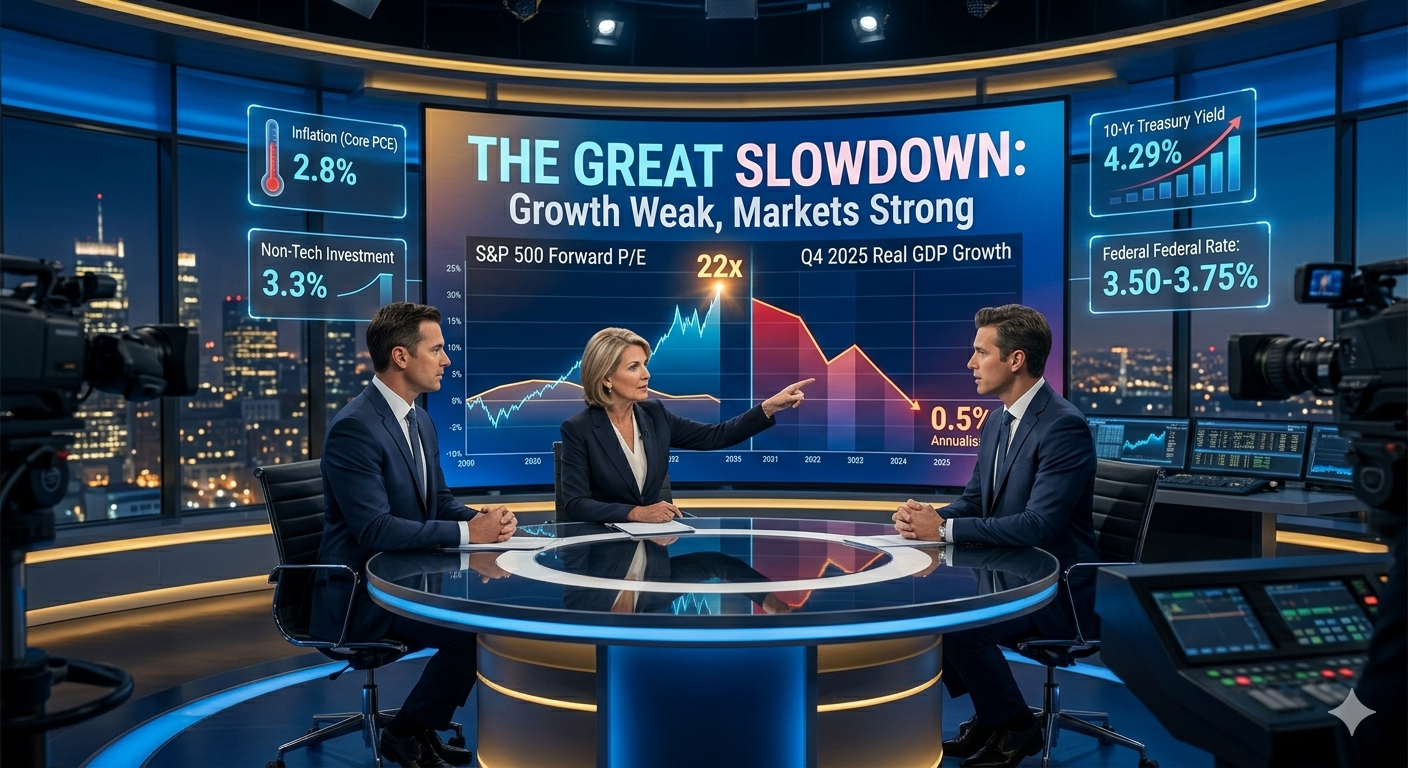
The Bureau of Economic Analysis handed Wall Street a stark number in late March 2026: Q4 2025 real GDP grew at just 0.5% annualised. The S&P 500, meanwhile, trades above a forward P/E of 22x. This is the paradox that defines the current moment, and the tension that investors can no longer afford to ignore.
By the Hemera Networks Markets Desk
WHAT'S NEWS
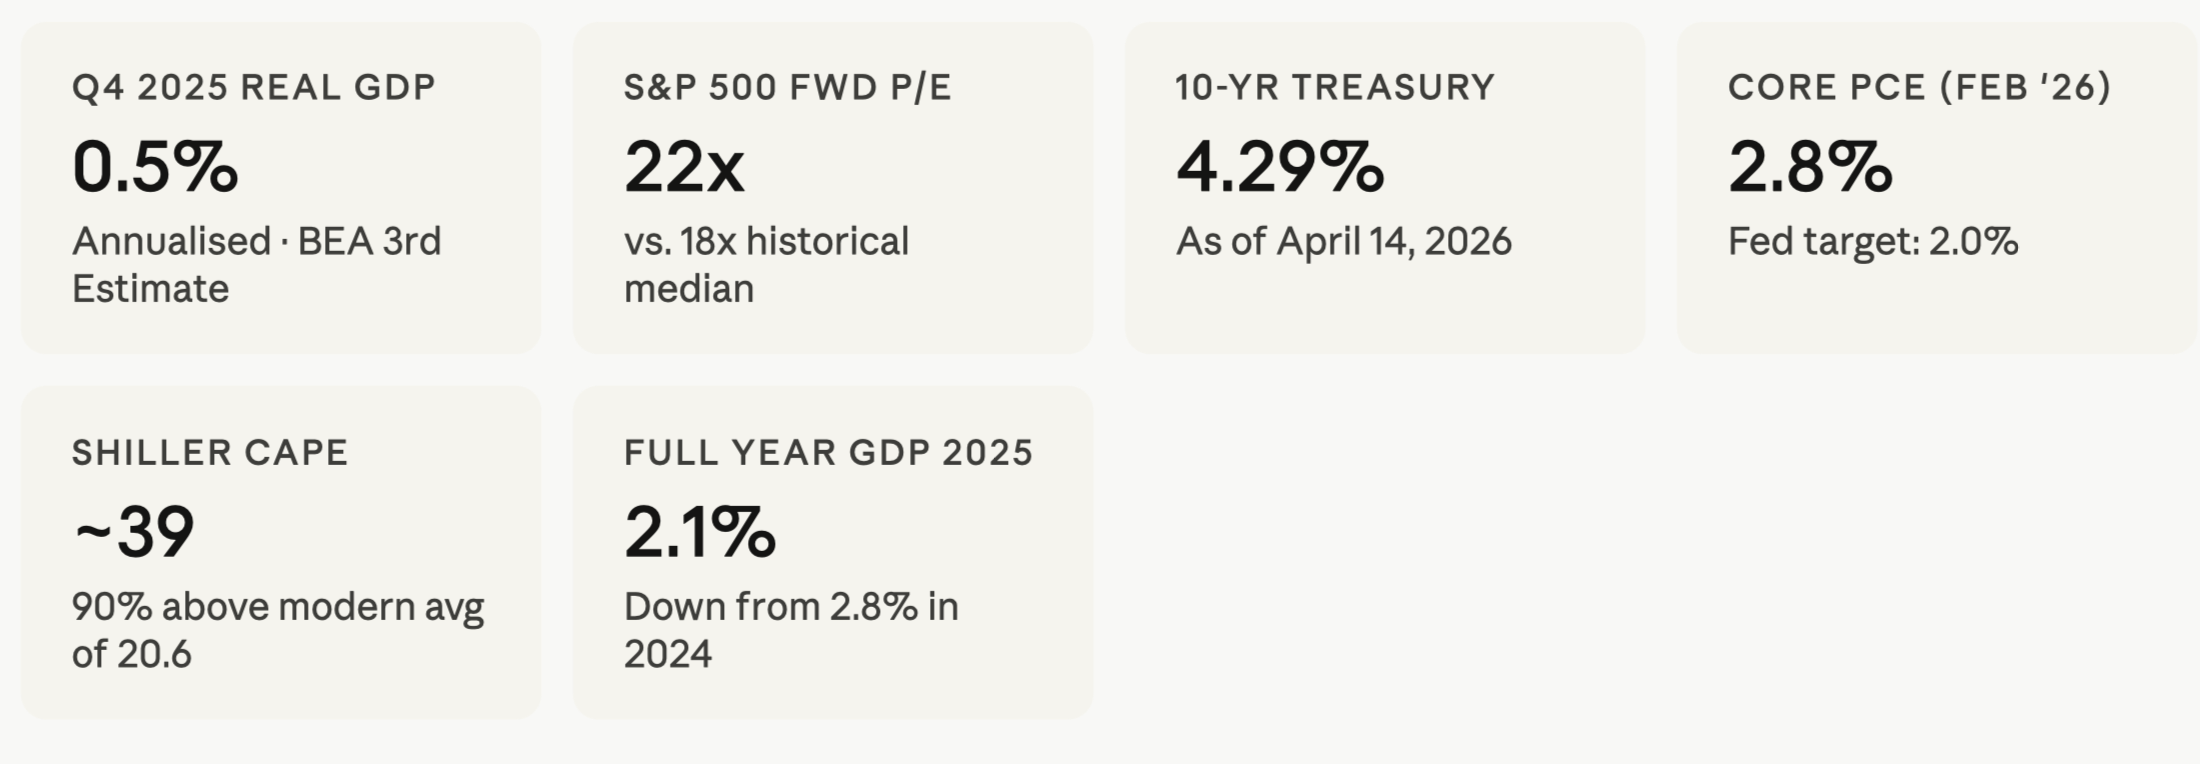
Real GDP expanded just 0.5% in Q4 2025 (annualised) - the weakest quarter since Q1 2025, after a 4.4% surge in Q3, with government spending subtracting a full percentage point as the longest federal shutdown in U.S. history dragged on.
Despite that GDP miss, equity markets remain richly valued: the S&P 500 forward P/E sits near 22x, matching the peak multiple of 2021, even as the 10-year Treasury yield holds above 4.29%, a structural floor driven by sticky core PCE inflation running above 2.8% year-on-year.
Investment growth is bifurcating dangerously: AI-linked capital expenditure drove roughly one-third of H1 2025 GDP growth, while non-tech investment stagnated; the Shiller CAPE ratio near 39 now sits 90% above its modern-era average, raising serious questions about whether premium multiples are justified by fundamentals or are entirely optionality-priced on an AI future that has yet to fully arrive.
THE NEWS PEG
On March 27, 2026, the Bureau of Economic Analysis released its third and final estimate for Q4 2025 GDP. The headline read 0.5% annualised growth. Three months earlier, the advance estimate had been 1.4%. The number was revised down twice, each pass stripping another layer of confidence from an already fragile picture. For full-year 2025, the economy grew 2.1%, down from 2.8% in 2024 and markedly below what the productivity-and-AI narrative had promised.
And yet equity markets barely flinched. The S&P 500 has clawed back ground after a volatile Q1, posting a weekly gain by April 10. Goldman Sachs opened the year projecting a 12% total return for 2026, citing "double-digit earnings growth" as the "fundamental base for a continued bull market." Deutsche Bank has an S&P 500 target of 8,000. The divergence between what the economy is delivering and what markets are pricing could not be starker, and it demands a harder look at both the causes of the slowdown and the logic, or illusion, sustaining the rally.
ACT I — THE ANATOMY OF A SLOWDOWN
The 4.4% Q3 2025 print was misleading in the way that a sugar rush is misleading. It masked a structural deceleration. The swing from 4.4% in Q3 to 0.5% in Q4, a spread of nearly four percentage points, is not normal cyclical noise. It reflects a convergence of self-inflicted wounds and structural headwinds that have been building since early 2025.
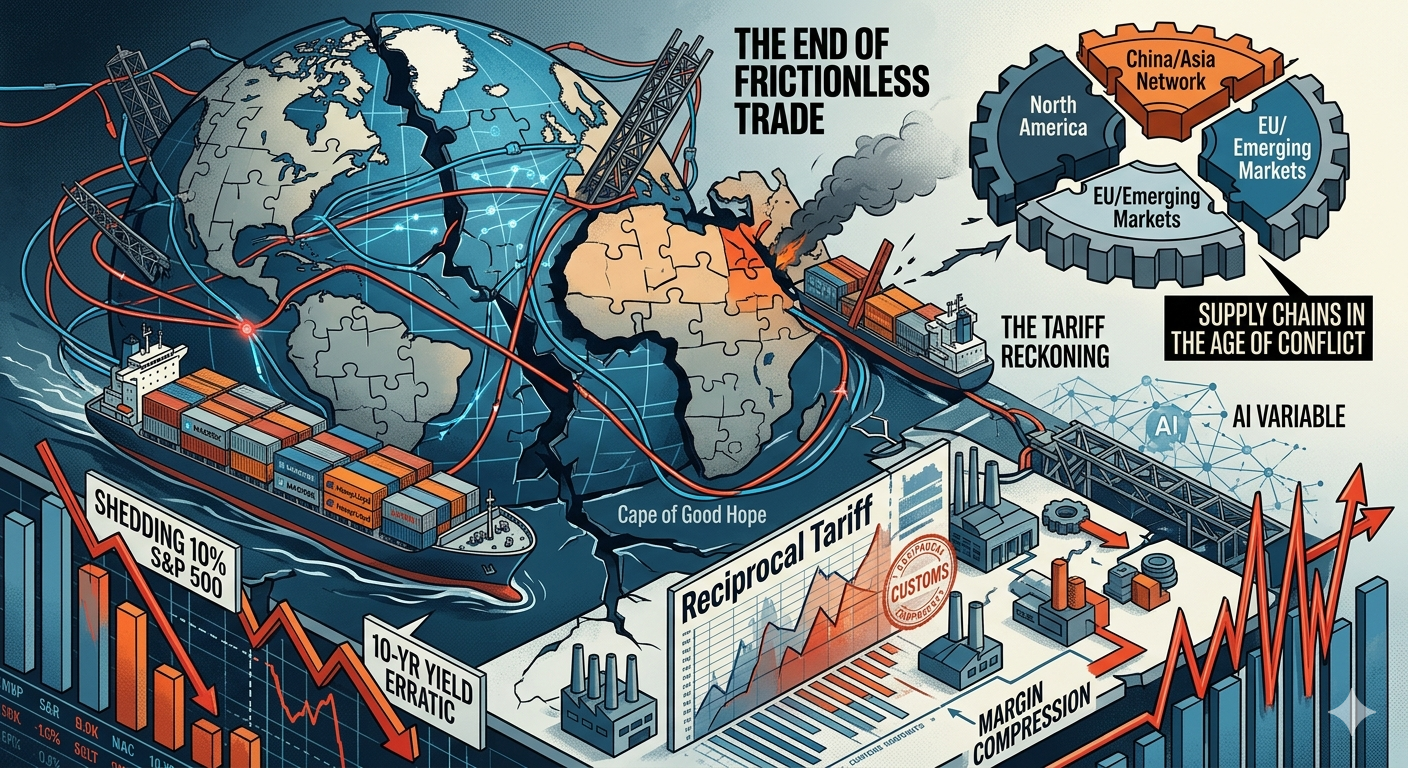
The most immediate culprit was government spending. Federal outlays collapsed 16.6% in Q4, subtracting nearly a full percentage point from GDP. The 24.3% plunge in non-defence spending was the second-largest quarterly decline in nearly 40 years. This was not market discipline at work; it was administrative paralysis, the longest government shutdown in U.S. history, which disrupted data collection, delayed payments, and injected policy uncertainty into an economy already strained by tariff-driven supply shocks and tighter immigration.
Tariffs compounded the problem with a lag. Goods trade was "incredibly volatile" through 2025 as importers and exporters recalibrated supply chains. Export prices rose sharply, a reminder that tariffs raise the cost of exports as well as imports. Meanwhile, residential investment fell 1.7% in Q4, structures investment dropped 6.5%, and consumer spending on goods slowed to just 0.3%.
A rare confluence of supply shocks — tariffs, tighter immigration, and elevated policy uncertainty — constrained activity, leaving growth below what strong organic productivity gains and rapid AI adoption would have otherwise supported.
— EY-Parthenon, Q4 2025 GDP Recap
The K-shaped divergence within those numbers is perhaps more troubling than the aggregate figure. High-income households, buoyed by equity wealth and strong income gains, continued to spend freely on services, services spending rose 2.7% even in Q4. Lower-income households, hammered by elevated prices, residual high financing costs, and the slow normalization of credit card and auto-loan delinquency rates, pulled back. This is not a recession in the classical sense; it is a bifurcated economy wearing the mask of resilience.
ACT II — THE AI INVESTMENT PARADOX
The one area immune to the slowdown narrative is technology infrastructure. AI-linked capital expenditure in software, research and development, and information processing equipment drove approximately one-third of GDP growth in the first half of 2025, according to EY-Parthenon analysis. Intellectual property investment surged 5.4% in Q4 even as the broader economy stumbled. Equipment investment held at 4.3%. The hyperscalers, Microsoft, Amazon, Alphabet, Meta, have committed hundreds of billions in data centre capex. This is real spending. It shows up in GDP.
The paradox is that this investment, which justifies much of the premium in equity valuations, has yet to translate into broad productivity gains for the non-tech economy. As EY's analysis noted, "non-tech investment has stagnated, held back by elevated tariff-related costs, heightened uncertainty and high financing costs." A business investing in AI-adjacent infrastructure is not the same as a mid-sized manufacturer in Ohio discovering productivity. The second-order effects that typically drive a genuine growth cycle, AI adoption spreading across services, healthcare, logistics, finance, remain a forward-looking thesis, not a current-period fact.
This is the crux of the valuation question. With the S&P 500's Shiller CAPE ratio near 39, nearly 90% above its modern-era average of 20.6, sitting 2.3 standard deviations above the mean, the market is not pricing today's economy. It is pricing a future where AI-driven productivity materialises broadly and swiftly. That may well happen. But the 10-year Treasury at 4.29%, with core PCE still running at 2.8%, means that the discount rate applied to that distant promise is significantly higher than it was in 2020 or 2021. High valuations require more flawless execution to justify, not less.
ACT III — THE BOND MARKET'S WARNING
One of the most significant structural shifts in financial markets this cycle has received less attention than it deserves: the yield curve has finally un-inverted. After a gruelling 27-month inversion, the longest in U.S. Treasury market history, the 10-year/2-year spread turned positive in mid-April 2026, reaching approximately +54 basis points. In ordinary circumstances, un-inversion signals economic recovery. In this instance, it signals something more troubling.
This is what analysts are calling a "bear steepener." The long end has risen faster than the short end, not because growth optimism is driving investors out of short-duration safety, but because the term premium is returning with force. Investors are demanding higher compensation to hold long-dated Treasuries, reflecting concern about persistent inflation, a federal deficit that remains above 6% of GDP, and the sheer supply of new issuance required to fund that deficit. The cost of servicing the national debt is hitting record levels.
The 10-year yield is a primary benchmark for long-term lending; its ascent signals that the cost of capital is once again recalibrating upward.
— FinancialContent Markets Analysis, April 7, 2026
Carson Group's chief macro strategist Sonu Varghese captured the contradiction bluntly: core PCE running above 4.5% on an annualised three-month pace through February, even before the geopolitical oil shock from the Middle East conflict. "This is starting to look like an 'Emperor Has No Clothes' moment: everyone can see inflation is too hot, but the Fed continues to avert its gaze," Varghese said. The Federal Reserve, operating at a funds rate of 3.50-3.75%, has held firm through 2025. FOMC minutes from March 2026 showed policymakers remain open to future rate hikes should inflation persist above 2%. Markets, as of mid-April, price less than a 25% chance of any cut by year-end.
The implication for equities is direct. The "Rule of 40", the heuristic in software and growth investing that a company's revenue growth rate plus profit margin should exceed 40%, is now being tested against a discount rate that punishes long-duration promises. The era of cheap money that allowed unprofitable growth companies to trade at 30x revenue is over. The capital structure of the next bull market will look different: fortress balance sheets, robust free cash flow, and demonstrable AI productivity gains, not aspirational ones.
ACT IV — HISTORICAL PARALLELS
Markets have been here before, not in identical circumstances, but in analogous configurations. The late 1990s saw the Nasdaq composite price a technological revolution years before the productivity gains fully arrived. The CAPE ratio peaked above 44 in December 1999. The economy was genuinely growing, real GDP in 1999 was above 4%, but the multiple expansion ran ahead even of that. The correction, when it came in 2000-02, was not because the internet failed. It was because valuations had priced perfection into an imperfect adoption curve.
Goldman Sachs Research itself has noted that "the US equity market's current combination of elevated valuations, extreme concentration, and strong recent returns rhymes with a handful of overextended equity markets during the last century." Yet Goldman is also careful to note that speculative trading remains well below the highs of 2000 or 2021, IPO volumes in 2025 were modest, and corporate leverage, while rising, remains low relative to history. These are meaningful differences. The current moment is not 1999. But "not as bad as 1999" is not the same as "fairly valued."
The more instructive parallel may be 1994-95. The Fed hiked aggressively in 1994 to pre-empt inflation. Growth slowed sharply. Markets sold off. And then, as the Greenspan Fed engineered a soft landing and productivity gains from the early internet era began filtering through the economy, equities recovered and the second half of the 1990s bull market began in earnest. The current question is whether the Fed, navigating a war-driven oil shock, a bifurcated consumer, and a technology cycle whose productivity dividend remains unrealised, can thread that same needle. The probability is not zero. But it is not as high as a 22x forward P/E implies.
THE OUTLOOK, WHAT MATTERS NOW
Deloitte's Q1 2026 forecast projects full-year growth of 2.2%, mathematically supported by the strong base of Q3 2025. By 2030, they expect real GDP to settle near its potential rate of 1.7%. RSM places 2026 growth at 2.2% but flags a "stagflation-lite" baseline scenario as the primary risk: inflation persistently above 2%, with real wage growth eroding consumer purchasing power, particularly for lower-income households.
EY-Parthenon puts U.S. recession odds at 40%, with risks skewed to the downside if the Middle East conflict escalates, a scenario in which oil above $100/barrel could push inflation toward 5% and clip more than a full percentage point off growth. The Strait of Hormuz is no longer a distant geopolitical abstraction; it is a supply chain variable inside every corporate earnings model for Q2 2026.
The most consequential variables to track are three: the monthly CPI print, which will reveal whether the oil shock has passed through to core inflation; Treasury auction demand, which will determine whether the bear steepener accelerates toward the psychologically critical 5% threshold on the 10-year; and corporate earnings guidance in the Q1 2026 reporting season, which begins this week. Forward earnings estimates for 2026 remain optimistic, S&P Global's consensus EPS forecast stands at $282 per share. If that number holds, a 22x multiple produces an S&P 500 near 6,200. If it is revised meaningfully lower, the arithmetic turns ugly quickly.
At current valuation levels, stocks don't need a crisis to fall — they only need disappointment.
— Investing.com Market Analysis, December 2025
The optimistic scenario, and it is not fanciful, is that the AI productivity dividend begins to register more broadly in 2026 and 2027. Goldman Sachs expects the next phase of the AI trade to shift from infrastructure capex to enterprise adoption: companies boosting efficiency, reducing unit costs, expanding margins. If that materialises with a Fed that manages to cut once or twice toward year-end as the oil shock fades, a genuine soft landing is achievable. In that scenario, the CAPE ratio of 39 might, with some future earnings growth, look less alarming in hindsight.
But the ground between here and there is strewn with variables. A federal deficit above 6% of GDP crowding out private investment. A bifurcated consumer in which the top quintile's spending conceals distress in the bottom half. A technology investment cycle that is real but concentrated, and whose broad diffusion remains a promise. And a geopolitical environment. from the Middle East to Taiwan Strait shipping risks, that has permanently raised the floor on energy price uncertainty.
The Great Slowdown is not a crash. It is something more insidious: an economy that is neither breaking down nor breaking out, while markets price the latter. The analytical task for investors in the months ahead is not to predict a recession, but to determine whether the premium they are paying today will be justified by the economy that actually arrives, not the one that was promised.
Corrections & Amplifications
Hemera Networks is committed to factual accuracy and welcomes substantive corrections. GDP figures are sourced from the Bureau of Economic Analysis third estimate (released March 27, 2026). Treasury yield data reflects market close April 14, 2026, per Trading Economics and FinancialContent. S&P 500 forward P/E sourced from Goldman Sachs Research (January 2026); Shiller CAPE sourced from CurrentMarketValuation.com. Any reader identifying a factual error is encouraged to submit a correction request through Hemera Networks editorial desk. Corrections will be published in the following edition.